
AI J-Curve
When can growing AI demand pay for the infrastructure behind it?
AI is moving from answering questions to doing work in the background, day and night. As more people and businesses use these agents, companies will need to keep building the computers and data centers that power them. We wanted to understand when the cash from that growing system could cover its running costs, pay for new capacity, and recover the money already invested.
Findings
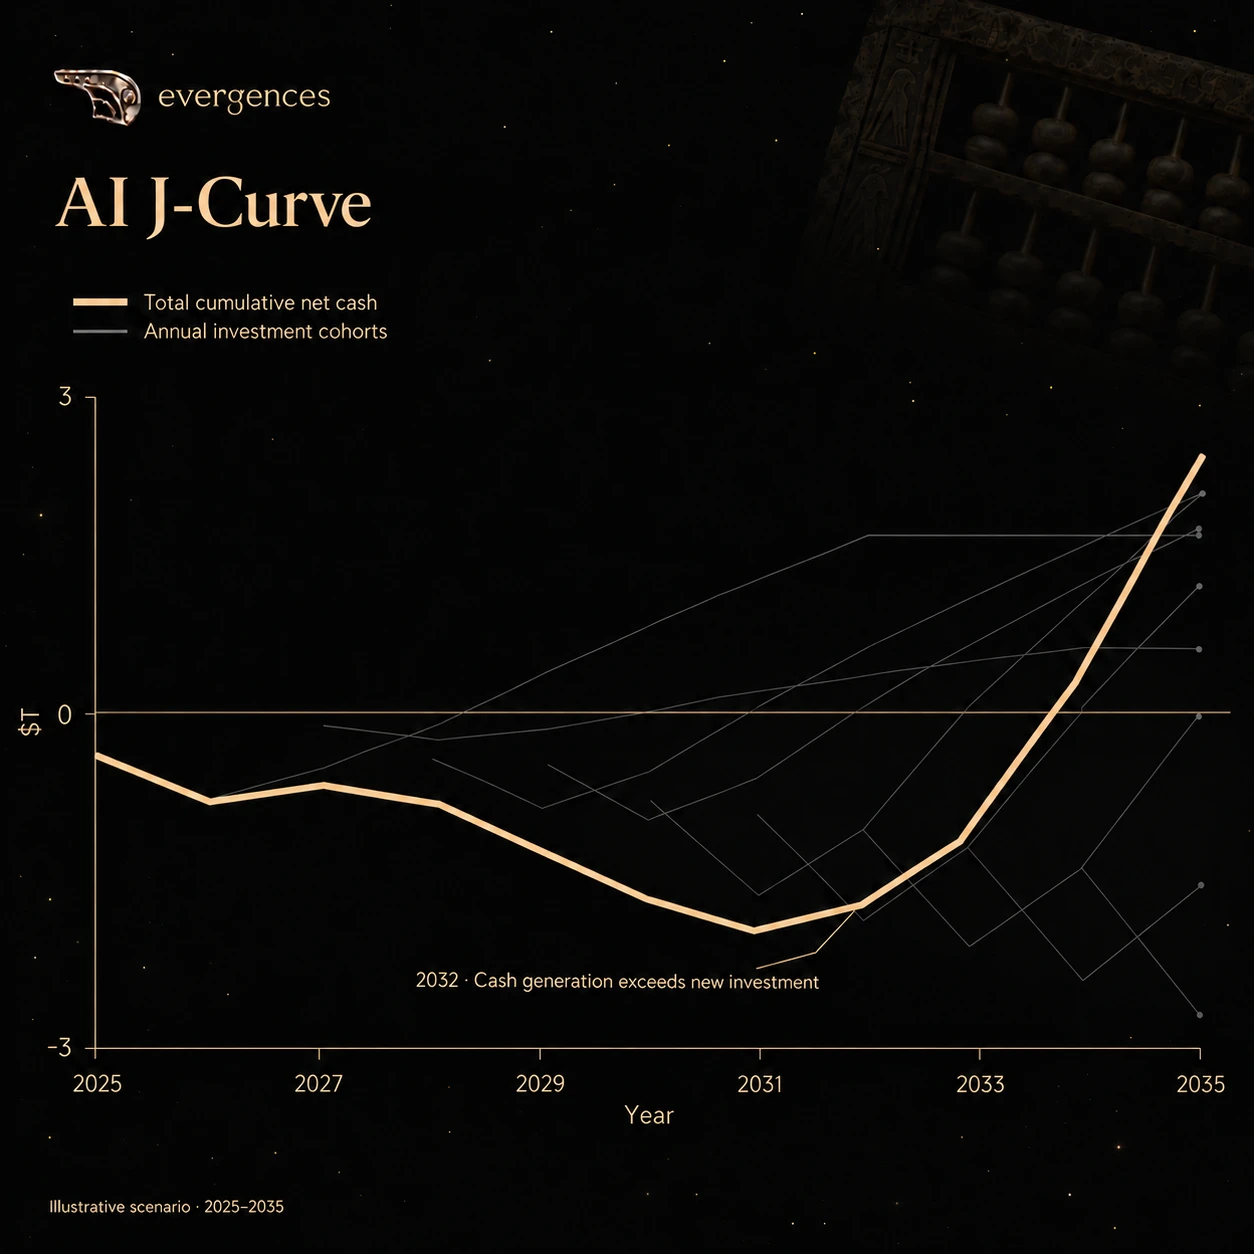
Even an installation that earns its money back quickly sits inside a fleet that keeps paying to add capacity. The thin lines show groups of projects committed in each year. The gold line adds their cumulative net cash together.
In this scenario, cumulative receipts cover capital paid and operating cash costs in 2034. Net cash reaches about $2.4 trillion by 2035. Another $1.6 trillion has been promised for future capital payments but has not yet been paid. These are conditional model results, not actual global totals or a forecast.
Assumptions
These are choices in the model, not measured facts:
- More people use AI, and each person uses more agents.
- Being available all day does not mean running at full speed all day. Active use rises from 10% of available hours in 2026 to 20% in 2035.
- Building takes two years. The equipment then works for six years. It starts at half speed in its first working year.
- The nine-month starting compute payback is an input used to set the starting price. It does not mean a whole project pays back in nine months.
- The amount of new capacity that can be delivered grows by 25% a year. Companies add projects when expected demand and returns support them.
- The selling price per unit falls 10% a year. Variable costs per unit fall 12% a year.
- We count only new investment from 2025 through 2035. Older assets are left out.
- About $1.6 trillion is money promised but not yet paid at the end of 2035. It is shown separately from the net cash already counted.
The question is whether cash generation can grow faster than the cost of expanding capacity.
Explore the scenarioAI ROI CalculatorEdit the assumptions and compare commitment-year cohorts.
—Sean